


2026 year-to-date results for Kingston and the area show lower sales volume but not the same price decline. With the first nine months of the year now complete, buyers have had more choice, sellers have faced more competition, and different property types have moved in noticeably different directions.
From January through September, 2,179 residential properties sold across Kingston and the surrounding area. That was down 6.6% from the same period in 2025. Total sales volume declined 7.1% to just over $1.35 billion.
Prices have been much steadier. The average selling price for the first nine months was $620,087, down only 0.5% from a year earlier. The median price was $575,000, down 0.9%.
That combination is an important part of the 2026 year-to-date story. Fewer homes have sold, but overall pricing has held up much better than the decline in sales volume might suggest.
What the 2026 year-to-date numbers show
January through September saw 5,788 new listings, up 1.8% from the same period last year. Average active listings increased 1.9% to 1,234.
Months of inventory rose to 5.1 from 4.7, while the sales-to-new-listings ratio slipped to 37.6 from 41.1.
These changes aren’t dramatic, but they have affected how buyers and sellers approach the market. Buyers have had more homes to compare, while sellers have faced more competition for attention.
The median number of days on market increased to 28 from 25. The average sale-to-list price ratio was 97.0%, compared with 97.3% a year earlier.
The 2026 year-to-date market has therefore required more patience from some sellers and given many buyers more time to decide than during tighter market conditions.
Prices have been steadier than sales.
One of the clearest trends through the first nine months of 2026 is the difference between sales activity and pricing.
Sales fell 6.6%, while the average selling price fell only 0.5%. The median price declined 0.9%.
The 2026 year-to-date price figures do not mean every neighbourhood or property type has moved by less than 1%. They show that the market has remained relatively stable despite fewer transactions.
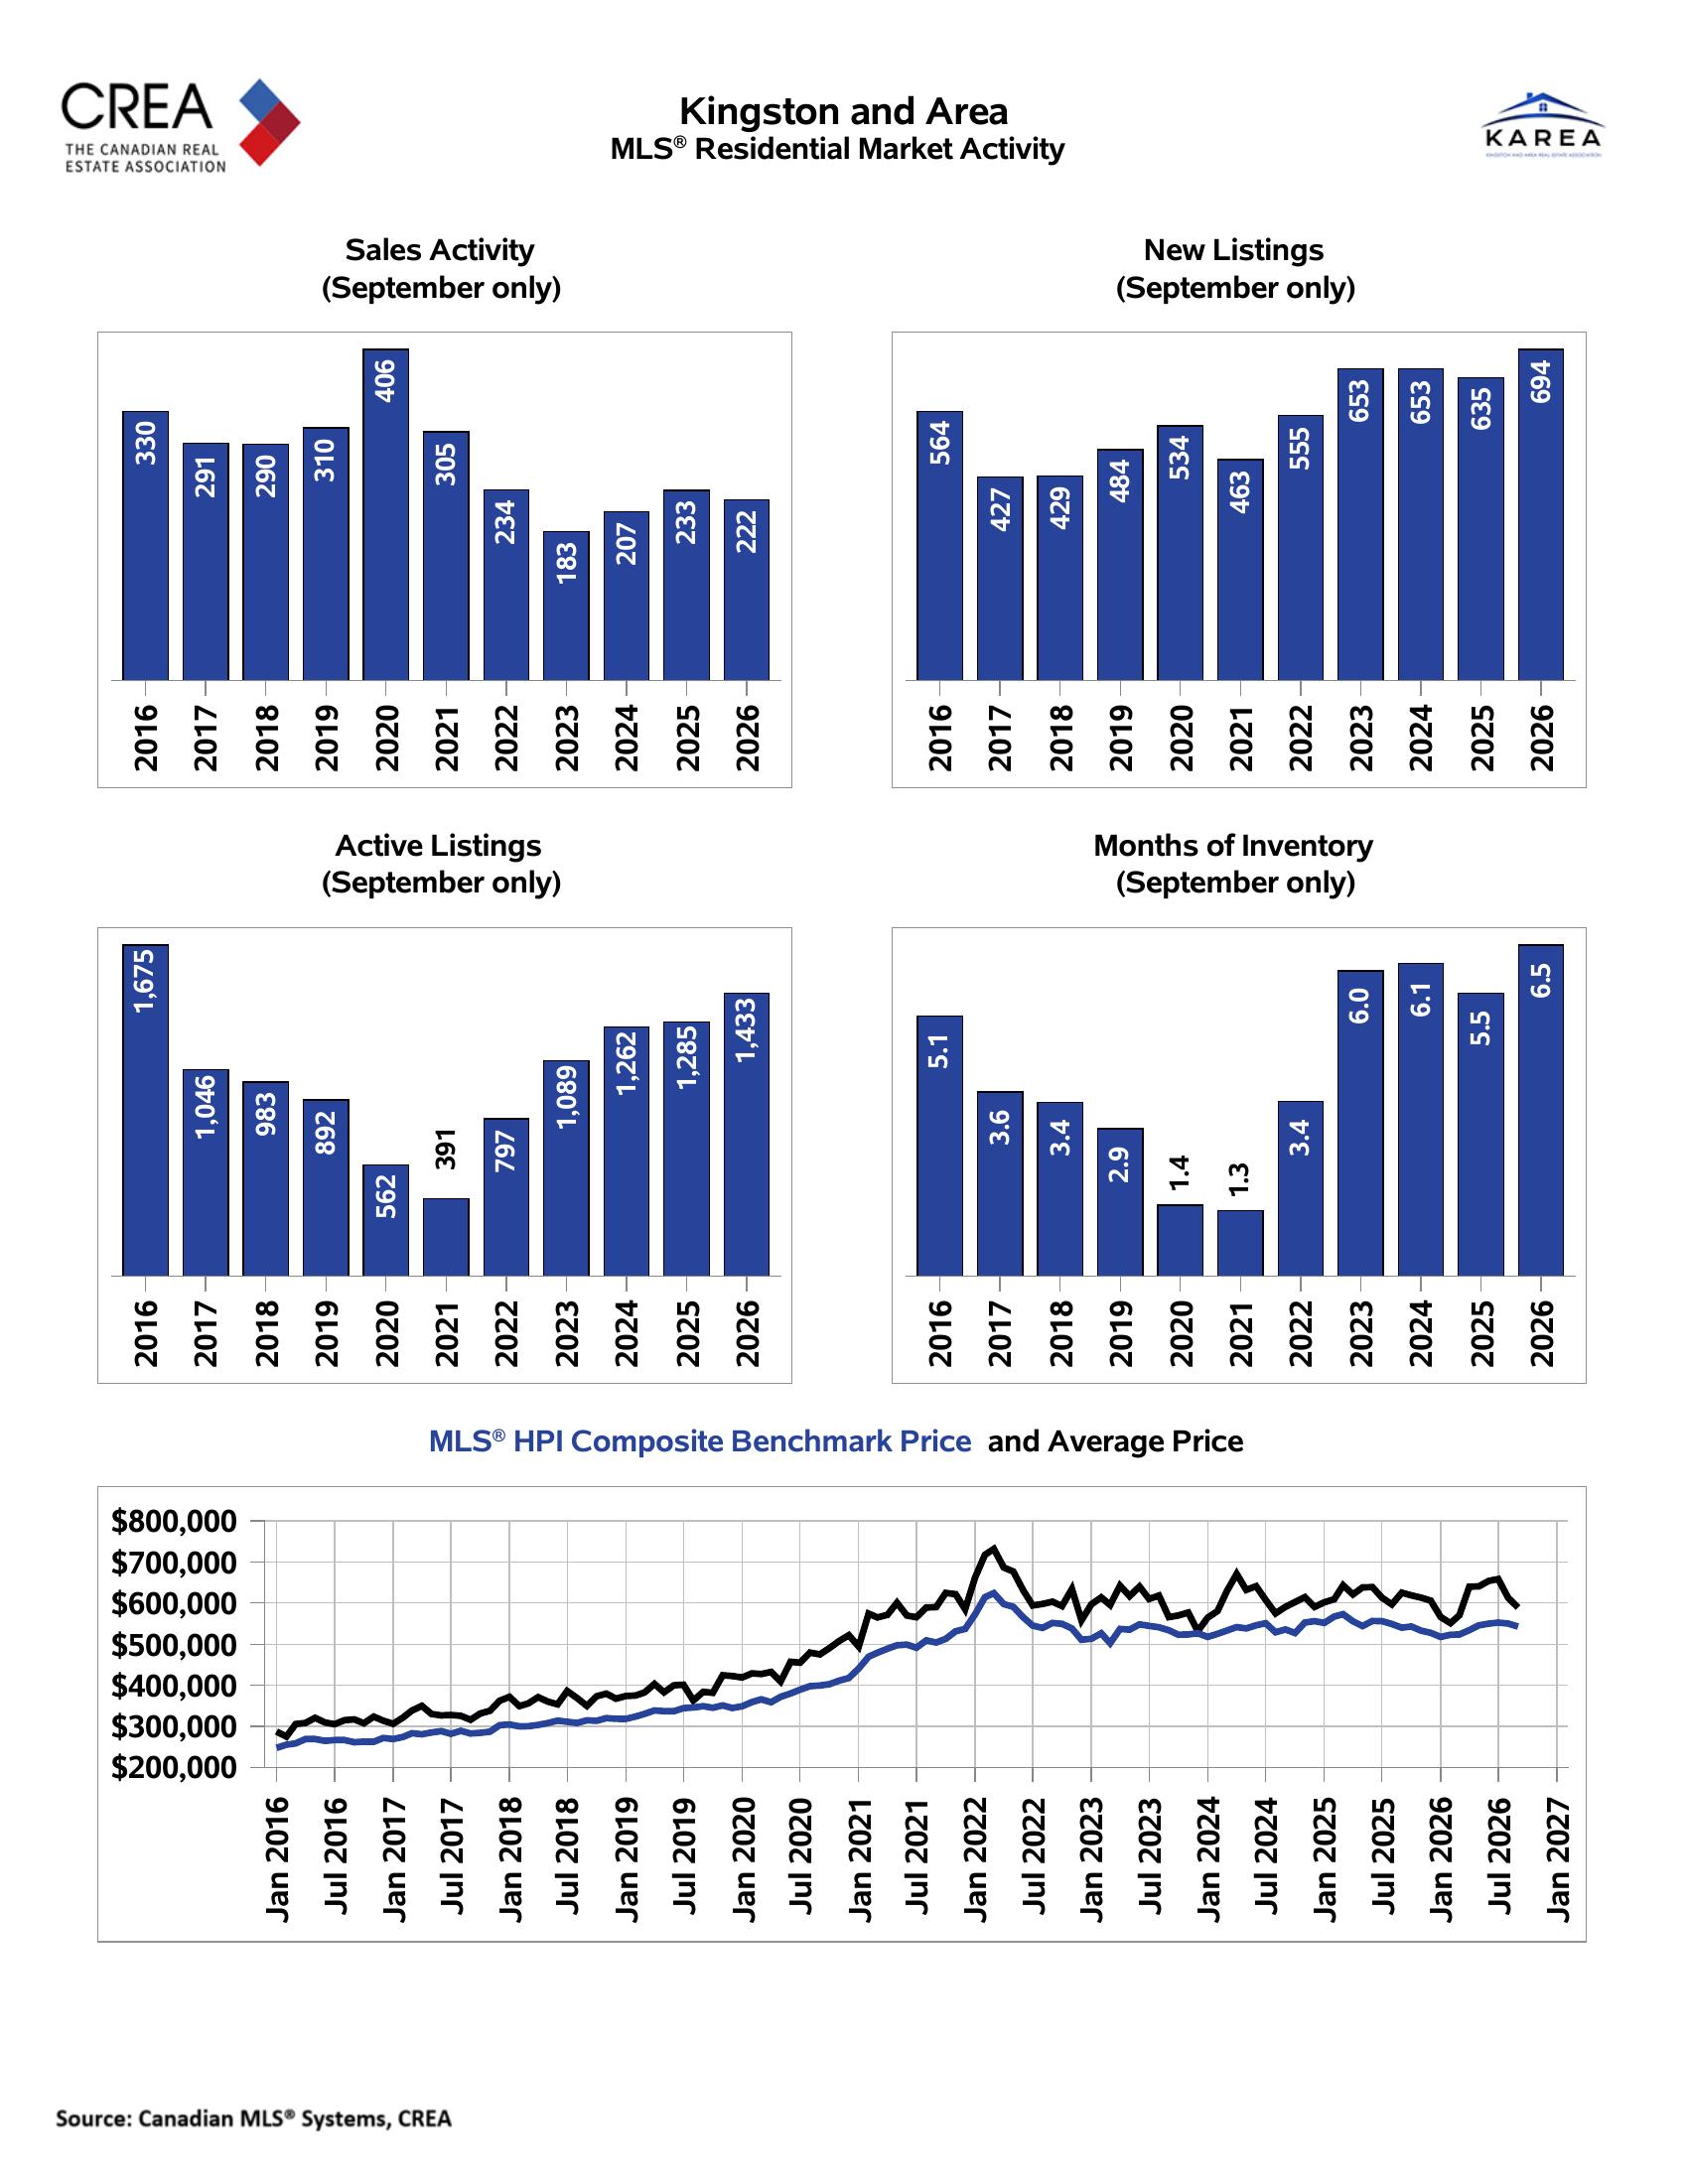
The MLS® Home Price Index provides another useful perspective. At the end of September, the composite benchmark price for Kingston and area was $542,800, up 0.5% from a year earlier.
The single-family benchmark was $566,800, up 0.2%. The townhouse benchmark was $403,300, up 4.0%, while the apartment benchmark was $342,700, down 5.6%.
Those differences remind us that one headline number cannot describe every part of the Kingston and area market.
Single-family homes remain the largest part of the market.
Single-family homes accounted for 1,764 sales through September, down 7.2% from the same period in 2025.
New single-family listings totalled 4,704, up 5.2%, while average active listings rose 4.8% to 966. Months of inventory rose from 4.4 to 4.9.
Despite the decline in sales, the average single-family price was $652,355, up 0.3%. The median price was $598,450, down just 0.3%.
Median days on market increased to 27 from 22.
This is one of the more interesting parts of the 2026 year-to-date results. Single-family sales have slowed, but prices have remained remarkably close to where they were a year ago.
For sellers, that means the market has not disappeared, but buyers have become more selective. For buyers, more choice does not automatically mean sharply lower prices.
Townhouse sales have slowed.
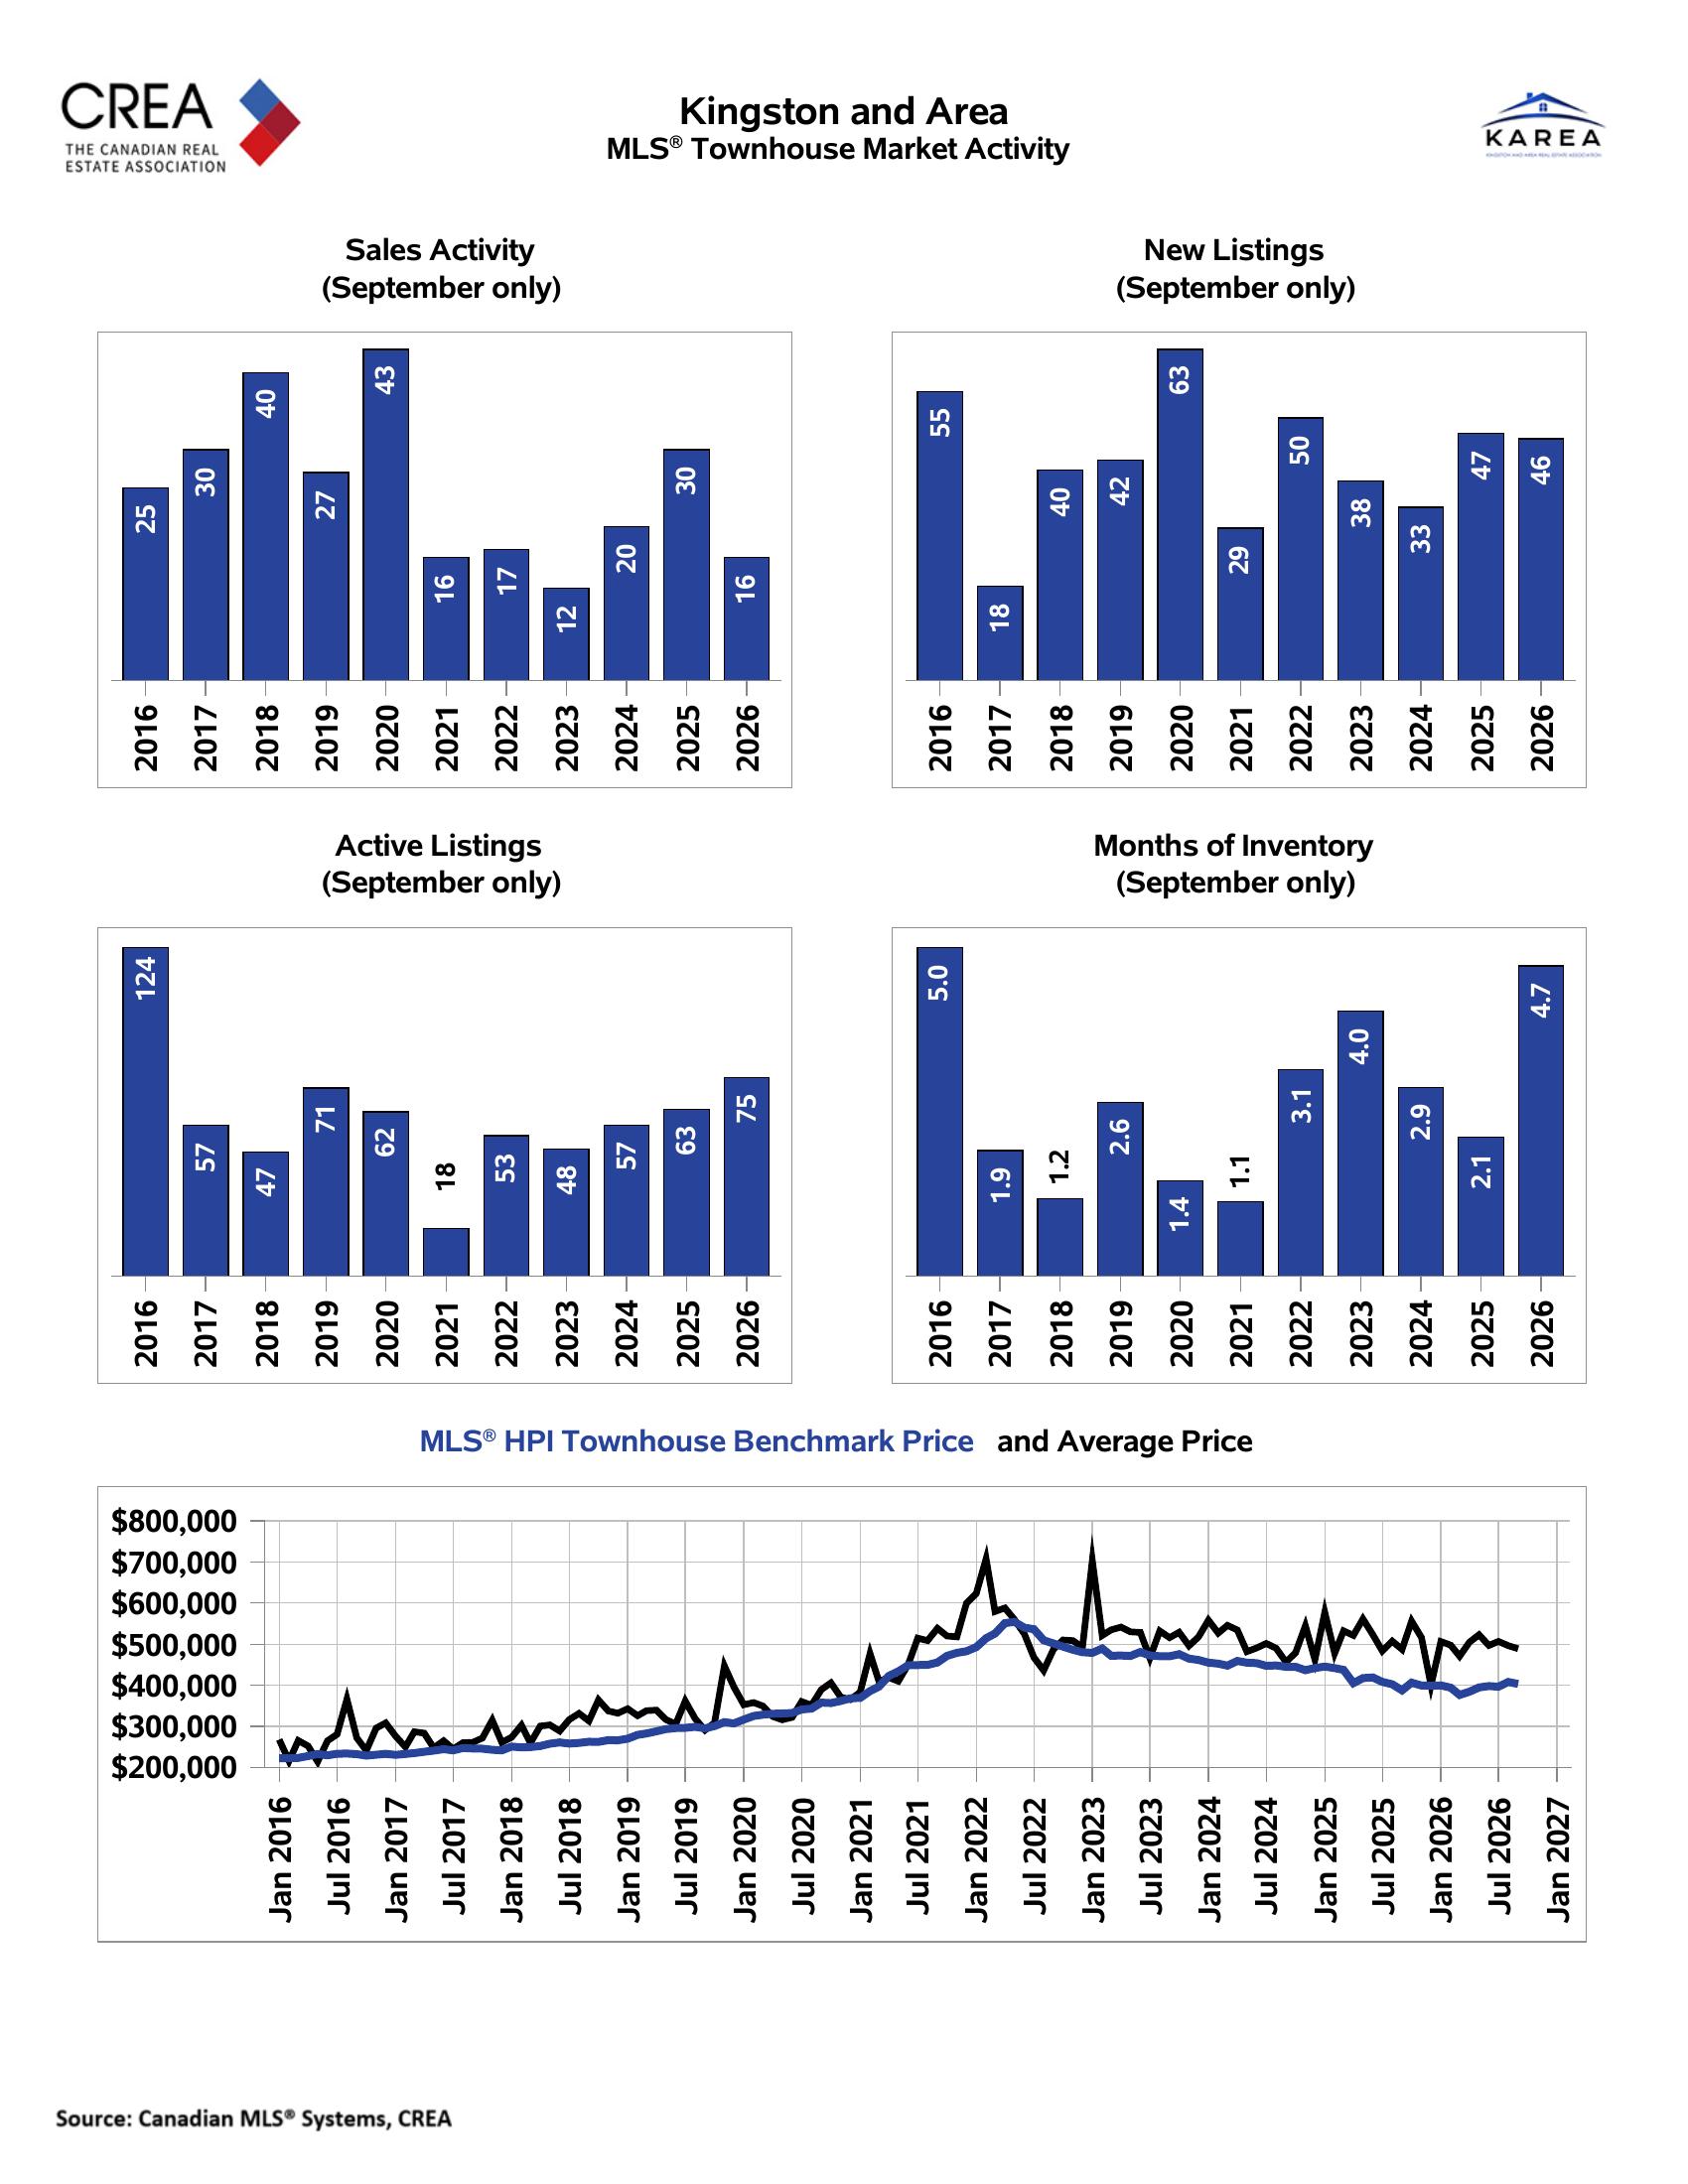
Townhouse activity has been softer during the first nine months of 2026.
Townhouse sales totalled 195 through September, down 12.9% from a year earlier. New listings also fell 11.6% to 404, while average active listings declined 11.7% to 78.
Months of inventory remained unchanged at 3.6.
The average townhouse price fell 2.7% to $501,828, while the median price fell 3.0% to $509,000. Median days on market edged up to 29 from 28.
However, the September townhouse benchmark price was 4.0% higher than a year earlier.
That difference between benchmark pricing and average selling price shows why it is important to look at more than one measure. The particular mix of townhouses sold during any period can push the average up or down.
Apartment condos tell a different story.
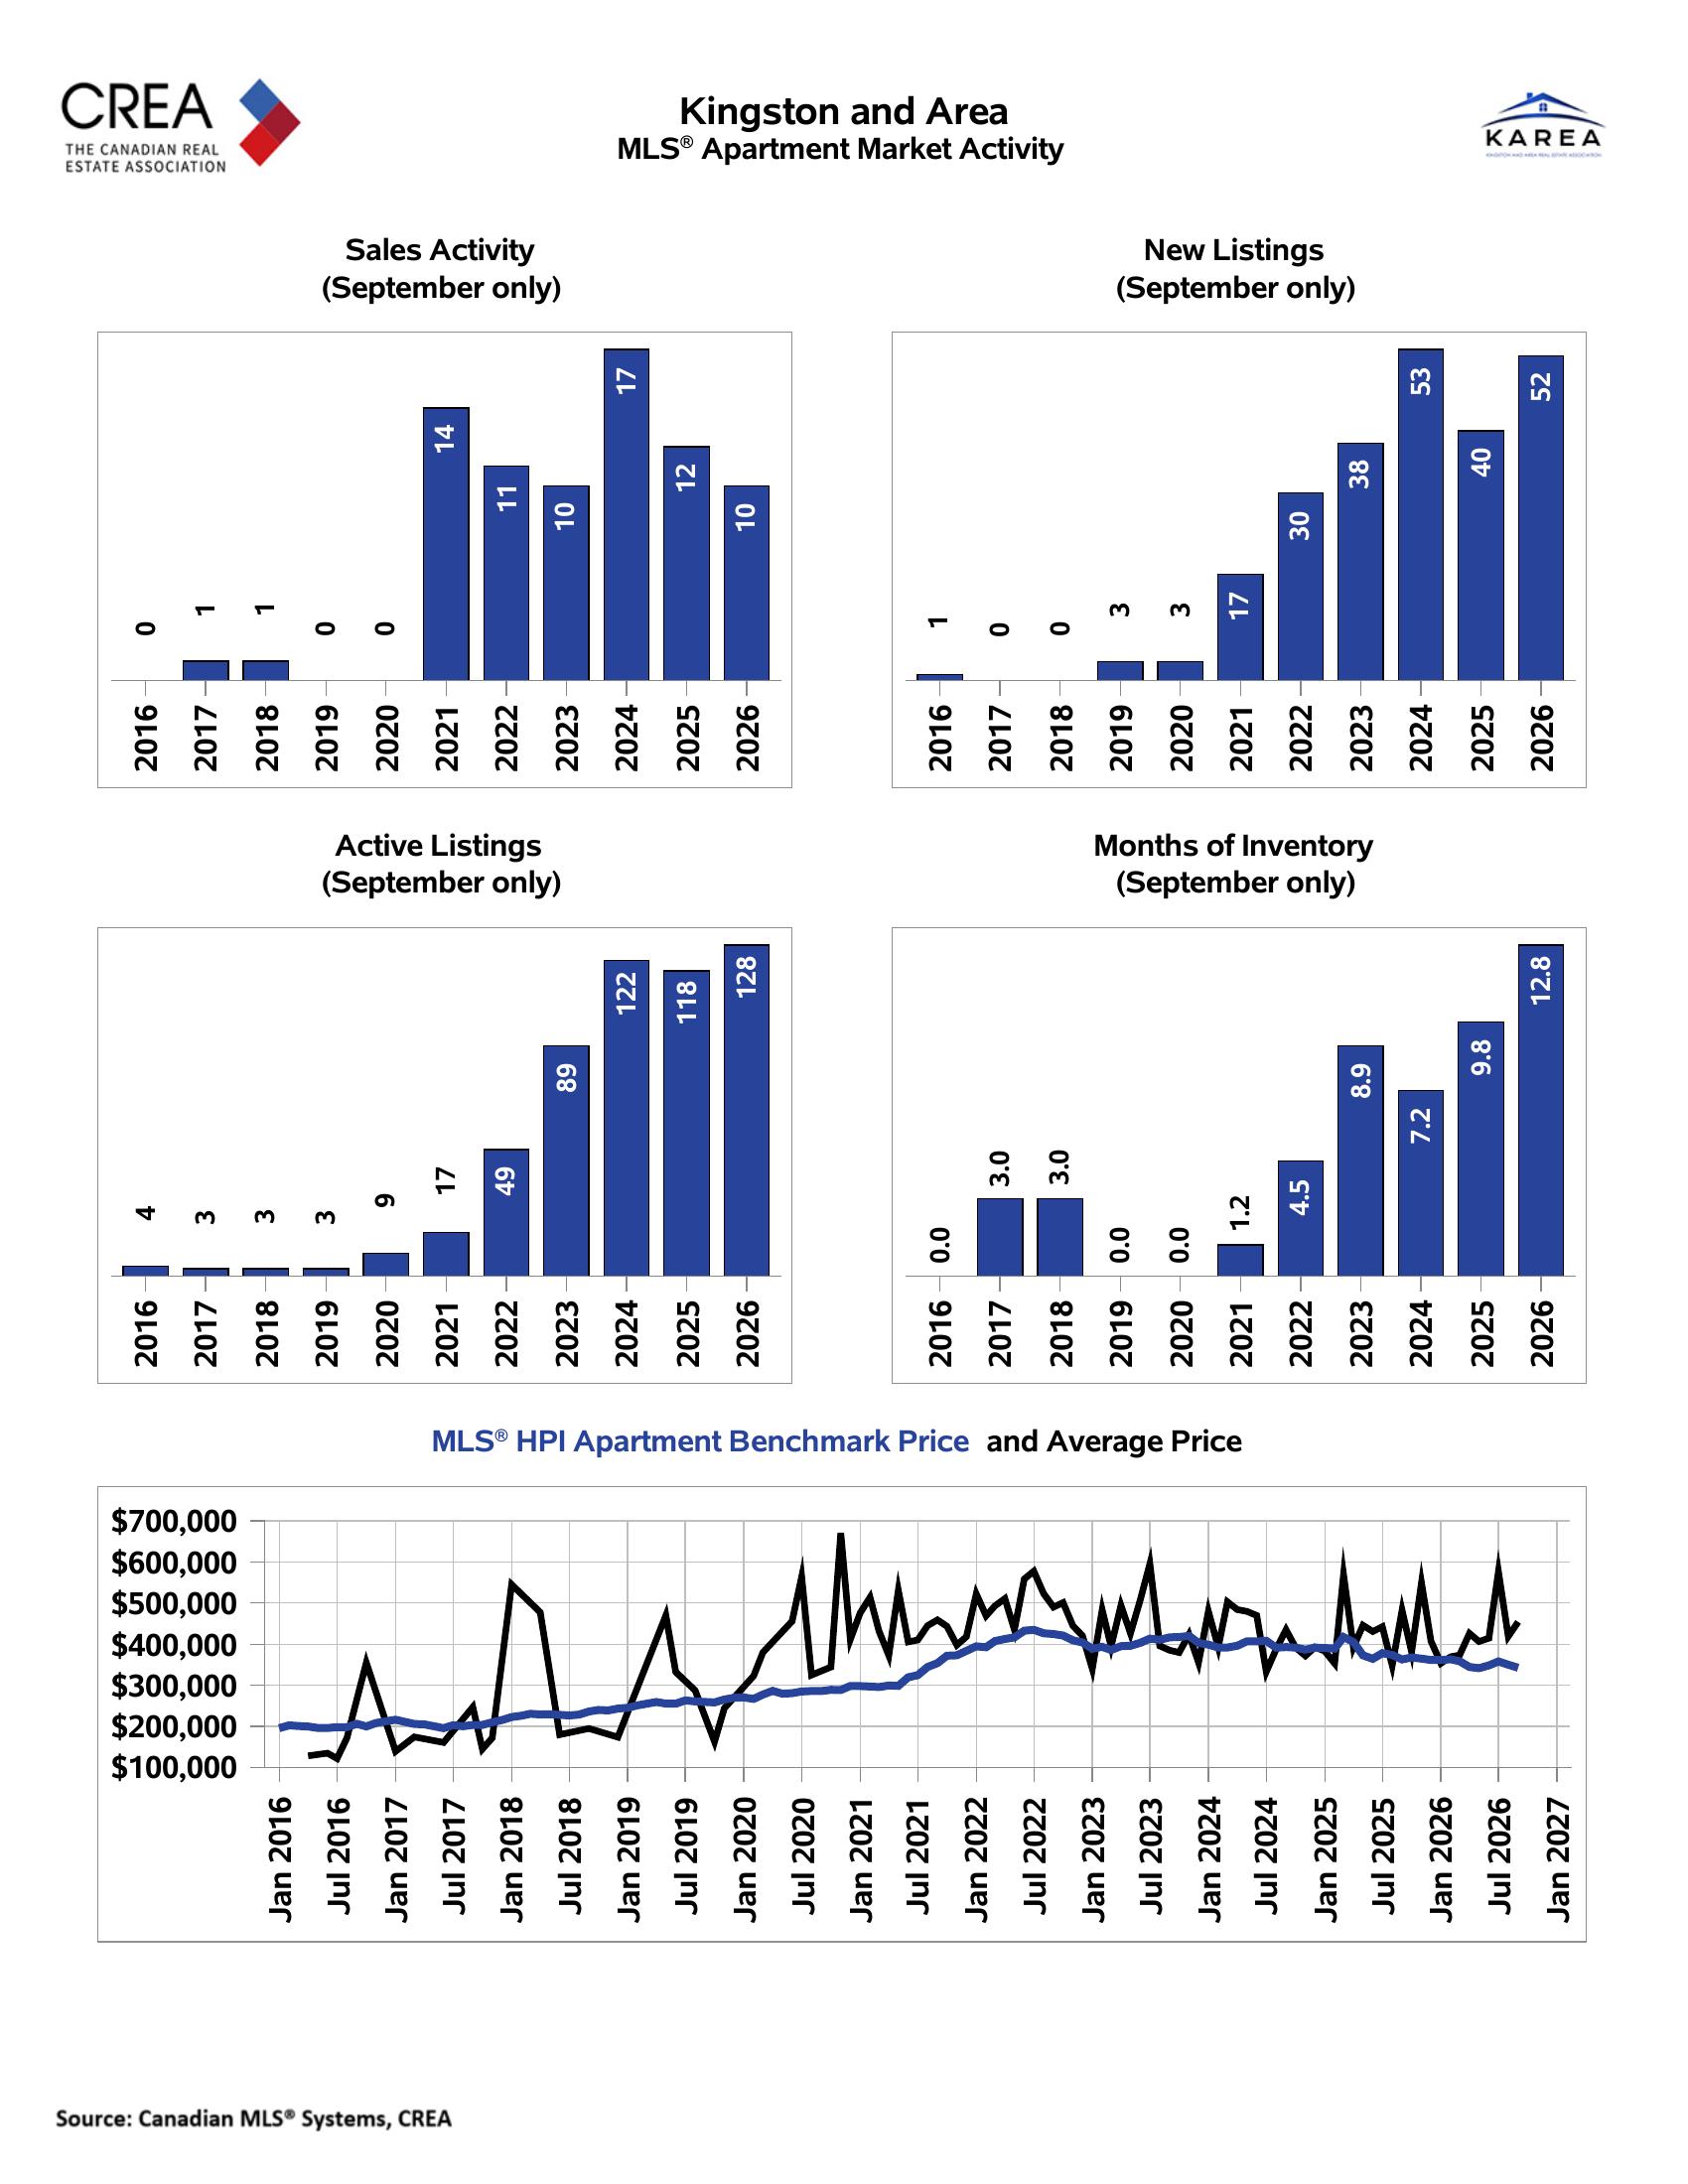
Apartment condominiums are one of the few property types to record more sales year-to-date in 2026.
Apartment sales totalled 143 through September, up 14.4% from the same period in 2025.
New listings fell 9.7%, while average active listings declined 11.4%. Months of inventory improved to 7.2 from 9.3.
The average apartment selling price fell 5.1% to $ 414,245. The median price, however, increased 6.6% to $355,000.
Median days on market fell to 37 from 45.
Those numbers show how mixed one part of the market can be. More condos have sold. Inventory has improved, and homes have sold faster, yet the average price has fallen.
The apartment benchmark price also remained weaker than other property types, ending September at $342,700, down 5.6% from a year earlier.
Kingston and the surrounding communities have moved differently.
The 2026 year-to-date figures also demonstrate why we should never treat Kingston and the area as a single, uniform market.
Across Frontenac, residential sales reached 298 through September, down 7.5%. New listings increased 16.9%, average active listings increased 13.1%, and months of inventory rose from 5.5 to 6.7.
Despite that increase in supply, the average selling price was $632,802, down only 0.2% from a year earlier.
Greater Napanee followed a different path. Sales totalled 146 through September, down 18.0%. Months of inventory rose from 6.7 to 7.7, while the average selling price fell 1.2% to $541,982.
These differences matter when buyers or sellers hear that “the market” is up or down. A rural property, a Kingston bungalow, a townhouse, and an apartment condominium can all be operating under different conditions at the same time.
Location, property type, condition, price range, and recent comparable sales remain far more useful than relying on one broad regional number.
What the 2026 year-to-date market means for buyers.
Buyers have more negotiating leverage than in the strongest seller’s markets, but they cannot buy every property at a significant discount.
More inventory and longer selling times allow buyers to compare homes more carefully. Depending on the property and competition, buyers may also have a better chance of including financing, inspection, or other conditions.
Even the strongest properties still attract considerable interest, especially when buyers find them well priced and hard to replace.
The best approach is to consider recent sales and current competition for the specific property type and location.
What the 2026 year-to-date market means for sellers
For sellers, pricing matters more when buyers have more alternatives.
Through September, homes took longer to sell, and the overall sale-to-list price ratio was slightly lower than the same period last year;
so an unrealistic asking price can cost a listing valuable exposure in its first few weeks.
A seller doesn’t need to underprice a home, but the asking price needs to make sense compared with competing properties and recent sales buyers are seeing.
It’s encouraging that overall prices have stayed fairly stable. The challenge is that buyers can afford to be more selective.
For an earlier look at how the year was developing, my April 2026 Kingston housing market update covered conditions one-third of the way through 2026.
A slower market, but not a simple one
Looking at the 2026 year-to-date results, Kingston and area have seen fewer sales, somewhat more inventory, longer selling times, and prices that have remained surprisingly steady overall.
Single-family prices have held up well. Townhouse sales have slowed; apartment sales have increased, and individual communities have followed their own paths.
For the latest monthly snapshot, read my September 2026 Kingston and area market report.
As we move through the last quarter of 2026, the next few months will show whether inventory continues to build, sales activity stabilises, or buyers and sellers move closer
together on price.
For the latest monthly snapshot, read my September 2026 Kingston and area market report.
As we move through the last quarter of 2026, the next few months will show whether inventory continues to build, sales activity begins to stabilize, or buyers and sellers move closer together on price.
Source: Kingston and Area Real Estate Association / Canadian Real Estate Association, September 2026 MLS® Residential Market Activity and Home Price Index Report.