


September 2026: More Choice Across Kingston and Area
September 2026 brought buyers more choice across Kingston and the area, while sales slowed and homes took longer to sell. The overall numbers also show why it is important to look beyond a single average price when assessing the local real estate market.
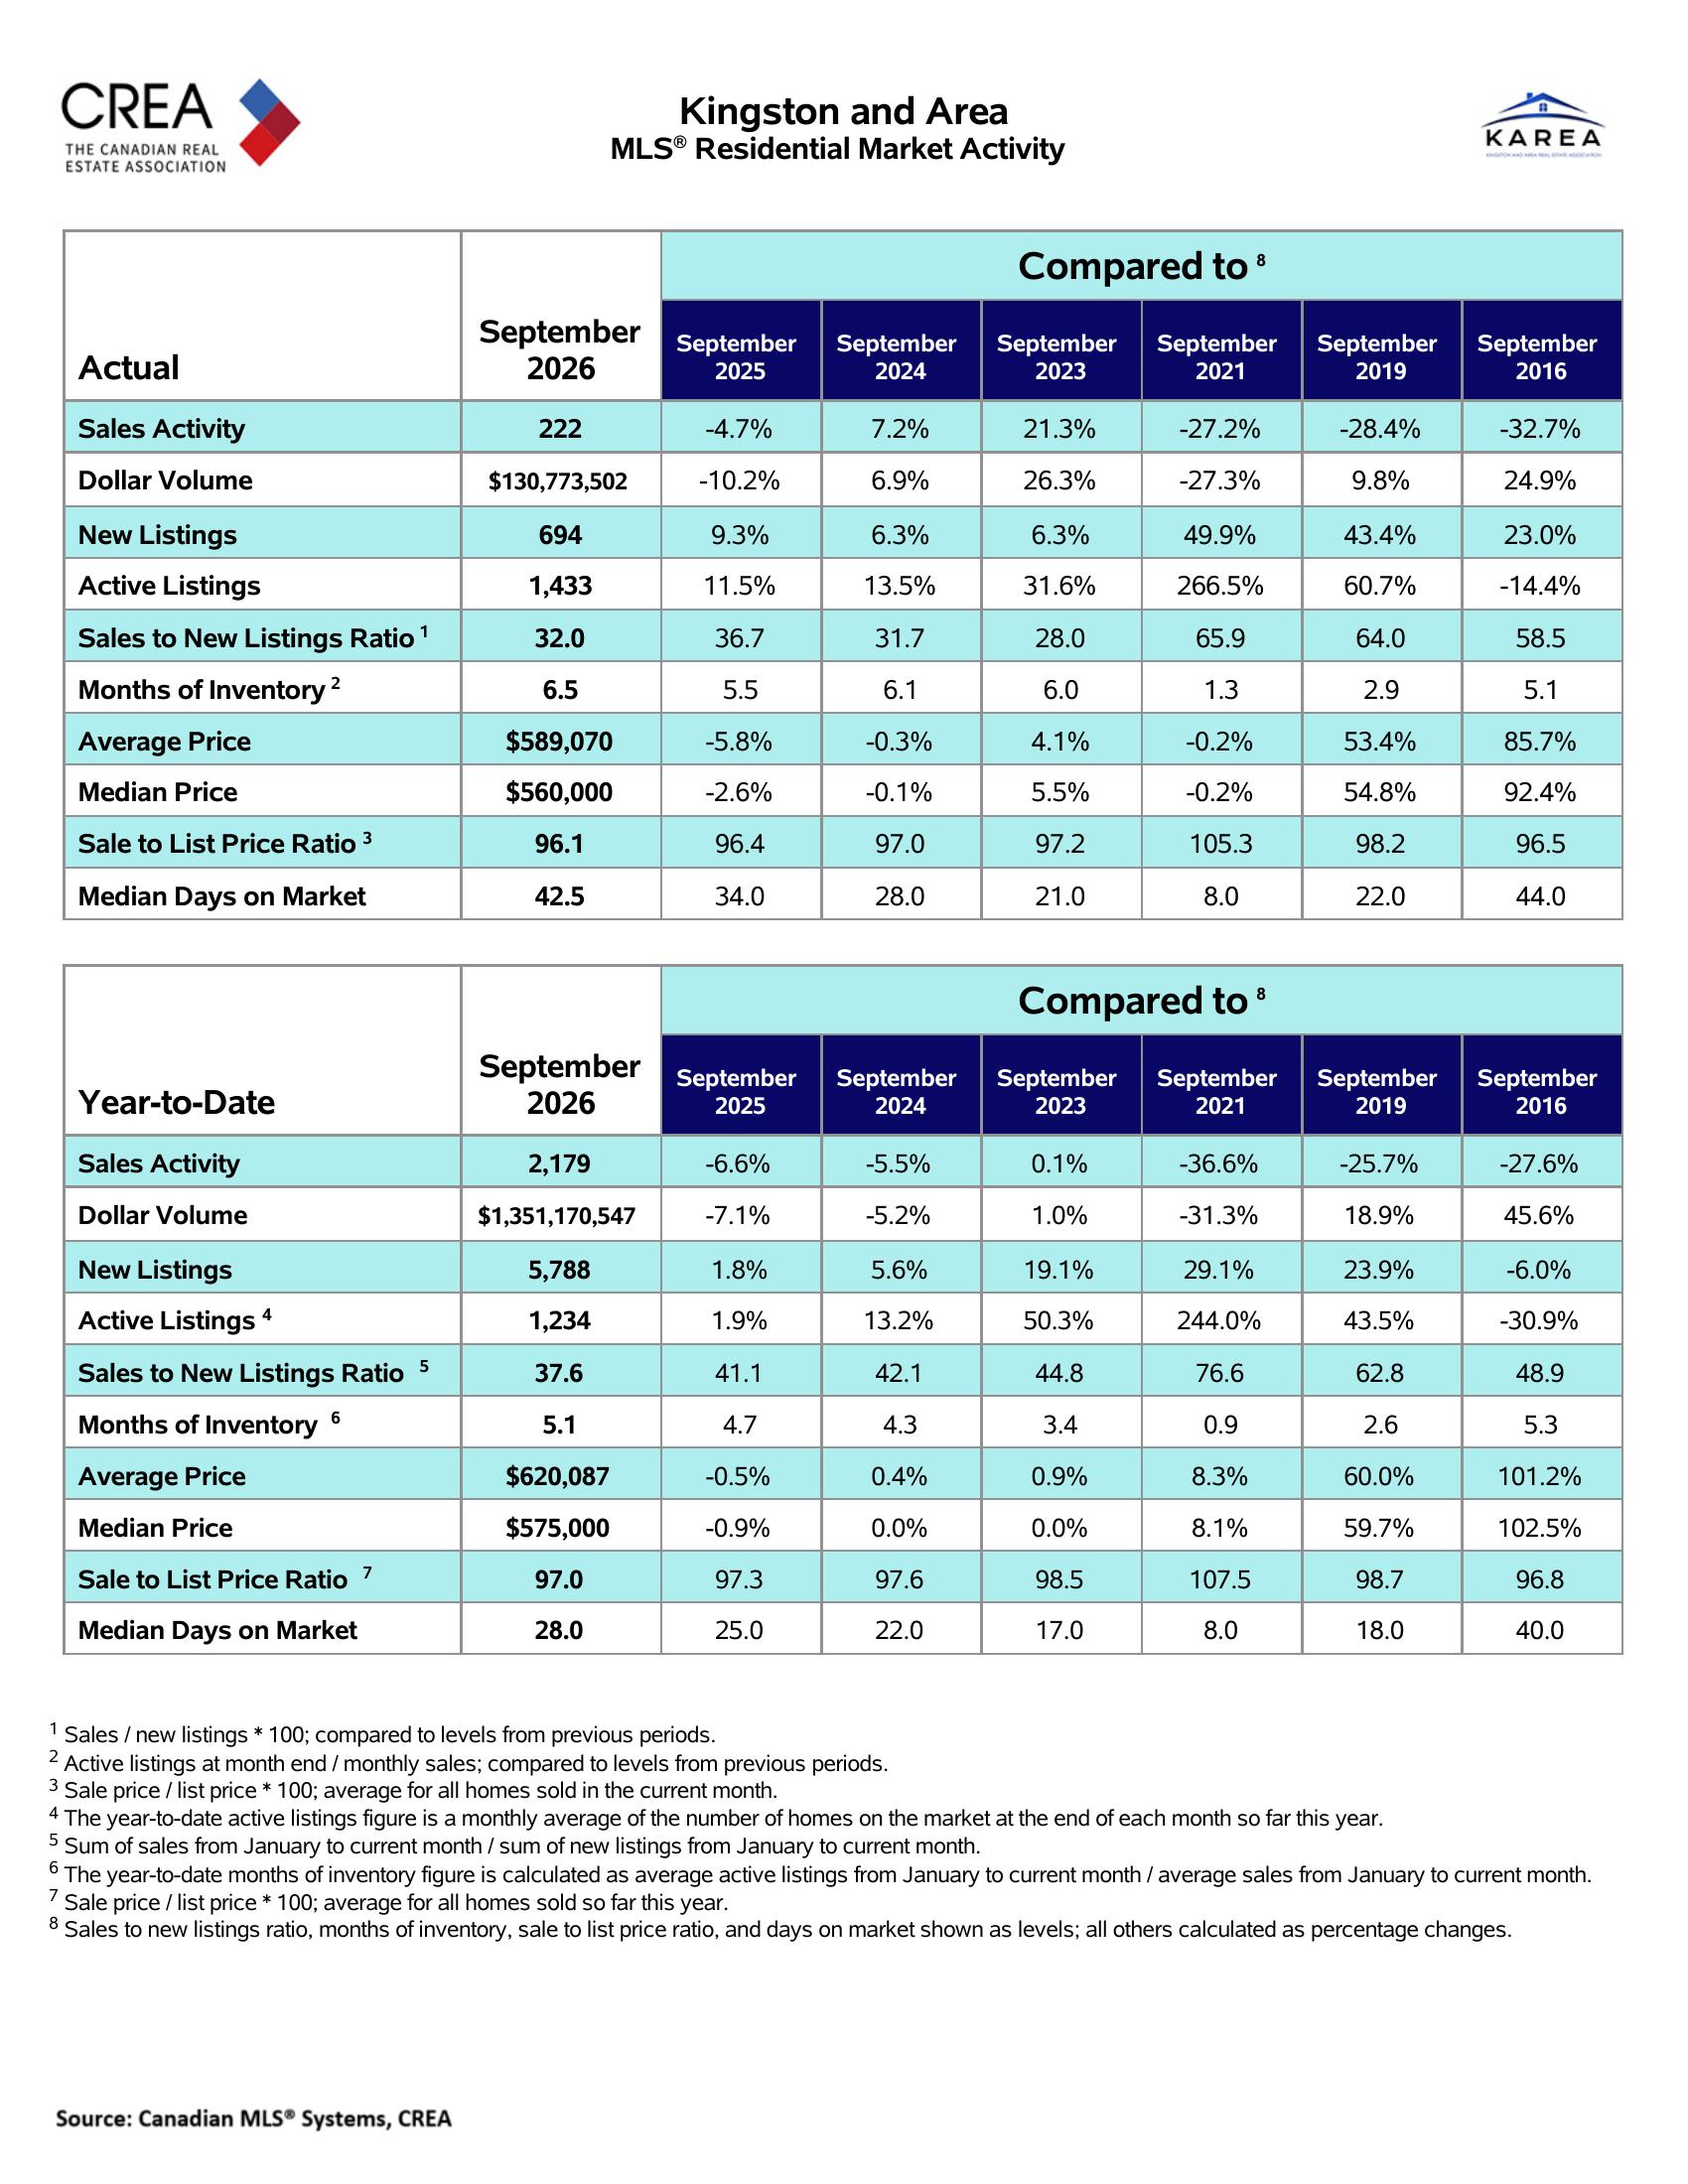
The month saw 222 residential sales, down 4.7% from September 2025. 694 new listings came to market, up 9.3%, while active listings reached 1,433, up 11.5%.
The average selling price in September 2026 was $589,070, down 5.8% from a year earlier. The median price was $560,000, down 2.6%.
Homes also took longer to sell. Median days on market increased to 42.5 days from 34 days last September, while sellers received an average of 96.1% of the listing price.
What September 2026 says about market balance
The increase in available inventory is one of September 2026’s most important takeaways
.
Based on actual monthly activity, inventory was 6.5 months, up from 5.5 months in September 2025. The sales-to-new-listings ratio was 32.0, down from 36.7 a year ago.
More active listings, more new listings, and fewer sales give buyers more opportunity to compare properties before deciding.
The seasonally adjusted figures tell a similar story. Adjusted sales fell 2.9% to 238 from August, while the adjusted average price fell 3.4% to $608,741. New listings declined 4.6% month over month, while active listings were almost unchanged.
The seasonally adjusted sales-to-new-listings ratio was 40.7, with 5.2 months of inventory.
September 2026 was therefore a more selective market than the strongest seller’s markets in recent years. That does not mean every home will sit on the market or that buyers can dictate terms. Well-priced properties in desirable locations can still attract strong interest.
It means buyers have more alternatives if a property doesn’t meet their needs.
Average prices and benchmark prices tell different stories.
The 5.8% year-over-year decline in the average selling price deserves some context.
Average prices can shift considerably from month to month, depending on which homes sell. A month with fewer expensive waterfront, rural, or luxury transactions can pull the average down even when a typical property’s value has moved much less.
The MLS® Home Price Index provides additional perspective.
The composite benchmark price for Kingston and area in September 2026 was $542,800. That was down 1.3% from August, but still 0.5% higher than one year earlier.
The single-family benchmark was $566,800, up 0.2% year over year. The townhouse benchmark was $403,300, up 4.0%, while the apartment benchmark was $342,700, down 5.6%.
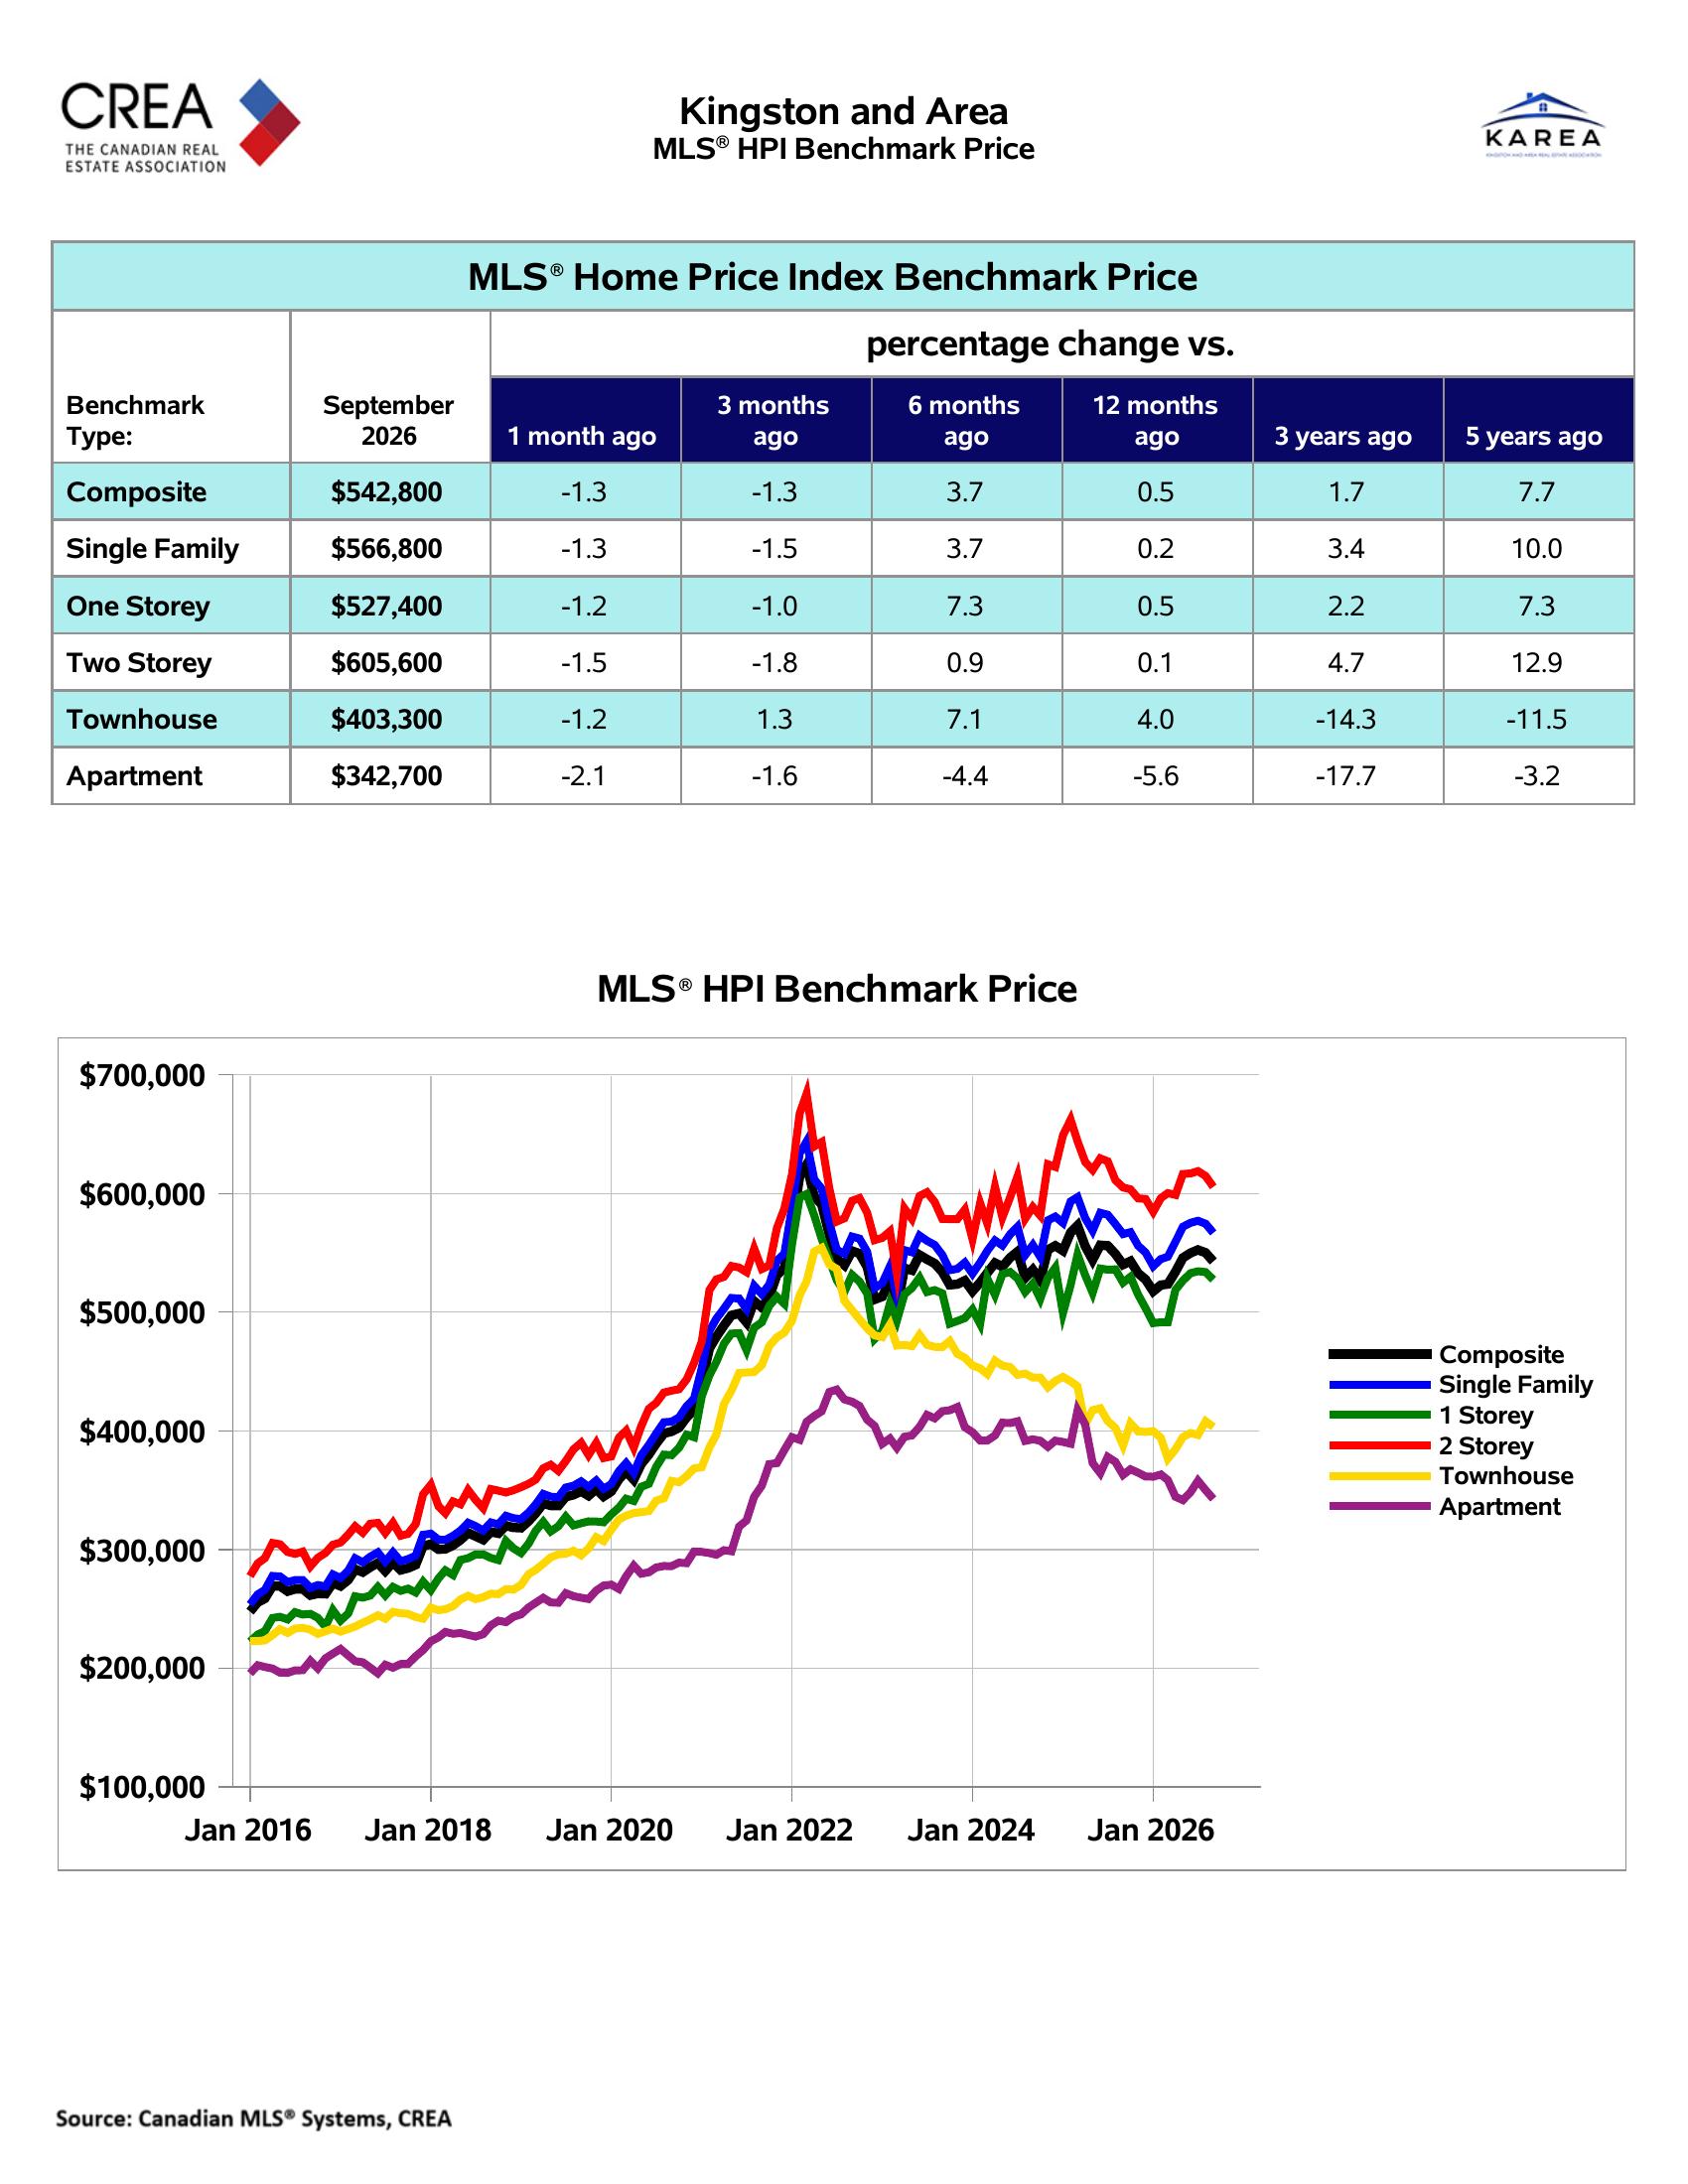
Those numbers explain why you shouldn’t interpret the 5.8% decline in the monthly average as a 5.8% decline in every home’s value.
Single-family homes remained active.
Single-family homes accounted for 186 of the 222 residential sales recorded across Kingston and the area in September 2026.
Sales were actually 3.3% higher than in September 2025, despite a lower average selling price.
The average single-family price was $613,213, down 9.0% from a year earlier, while the median price was $577,000, down 5.6%.
Supply increased at the same time. New single-family listings rose 11.0% to 575, and active listings rose 12.1% to 1,155. Months of inventory increased from 5.7 to 6.2.
Median days on market rose from 31.5 to 40 days.
This is a useful example of why you should consider sales activity and prices separately. More single-family homes sold than a year ago, but buyers had more properties to choose from, and the mix of homes sold produced a lower average price.
Townhouse sales plunged.
Townhouses had a much quieter September 2026.
Townhouse sales totalled only 16, down 46.7% from 30 the year earlier.
New listings were almost unchanged at 46, but active listings increased to 75 from 63. Months of inventory rose sharply from 2.1 to 4.7.
The average selling price was $488,906, up just 0.3% from last September, while the median price declined 2.0% to $487,000.
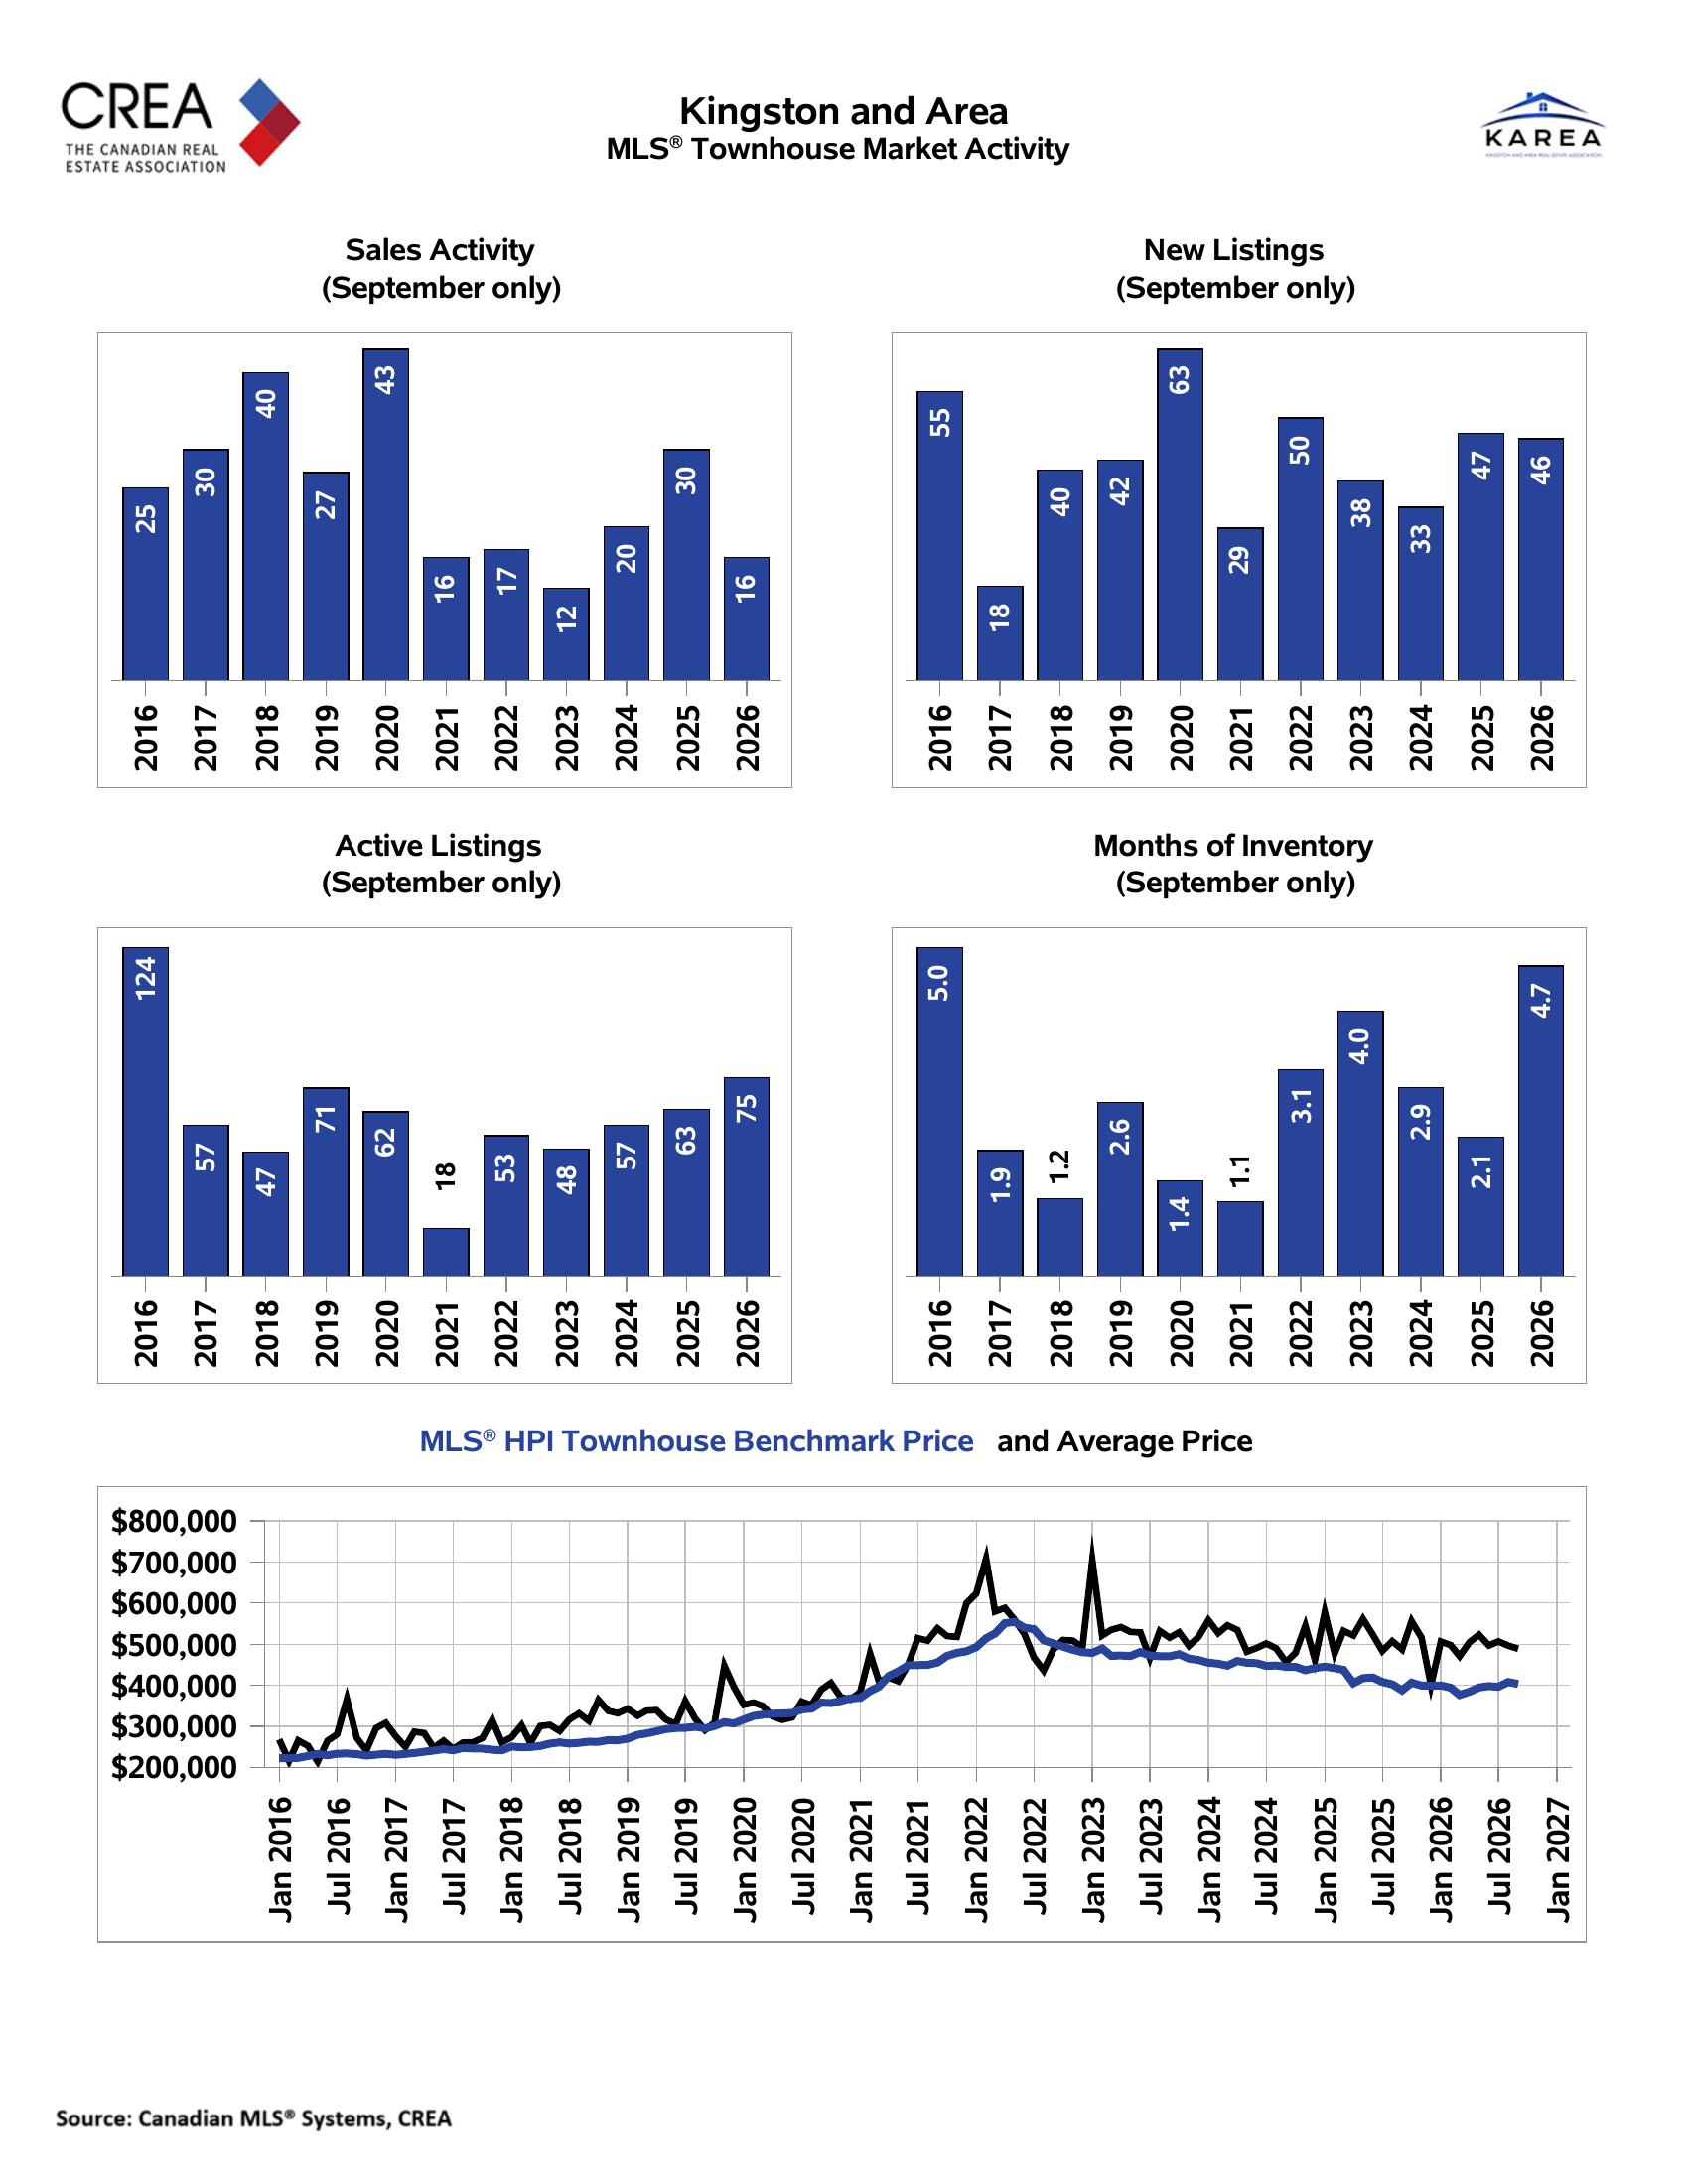
The townhouse benchmark price tells a somewhat stronger story, reaching $403,300, up 4.0% year over year.
For townhouse buyers, the increase in available inventory may matter more than a small move in the average selling price. More choice can give buyers more time to compare location, condition, condominium or POTL costs (where applicable), and recent comparable sales.
Apartment condos remained buyer-friendly
Apartment condominiums remained one of the market’s softer segments in September 2026.
Only 10 apartment sales occurred, down 16.7% from the previous year.
52 new listings hit the market, up 30%, while active listings rose to 128. Months of inventory reached 12.8, compared with 9.8 months in September 2025.
The average apartment selling price fell 5.9% to $ 454,032. The median price was $490,000, although with only 10 sales, the particular units that sold can heavily influence both figures.
The apartment benchmark price of $342,700, down 5.6% year over year, provides a broader indication of pricing trends.
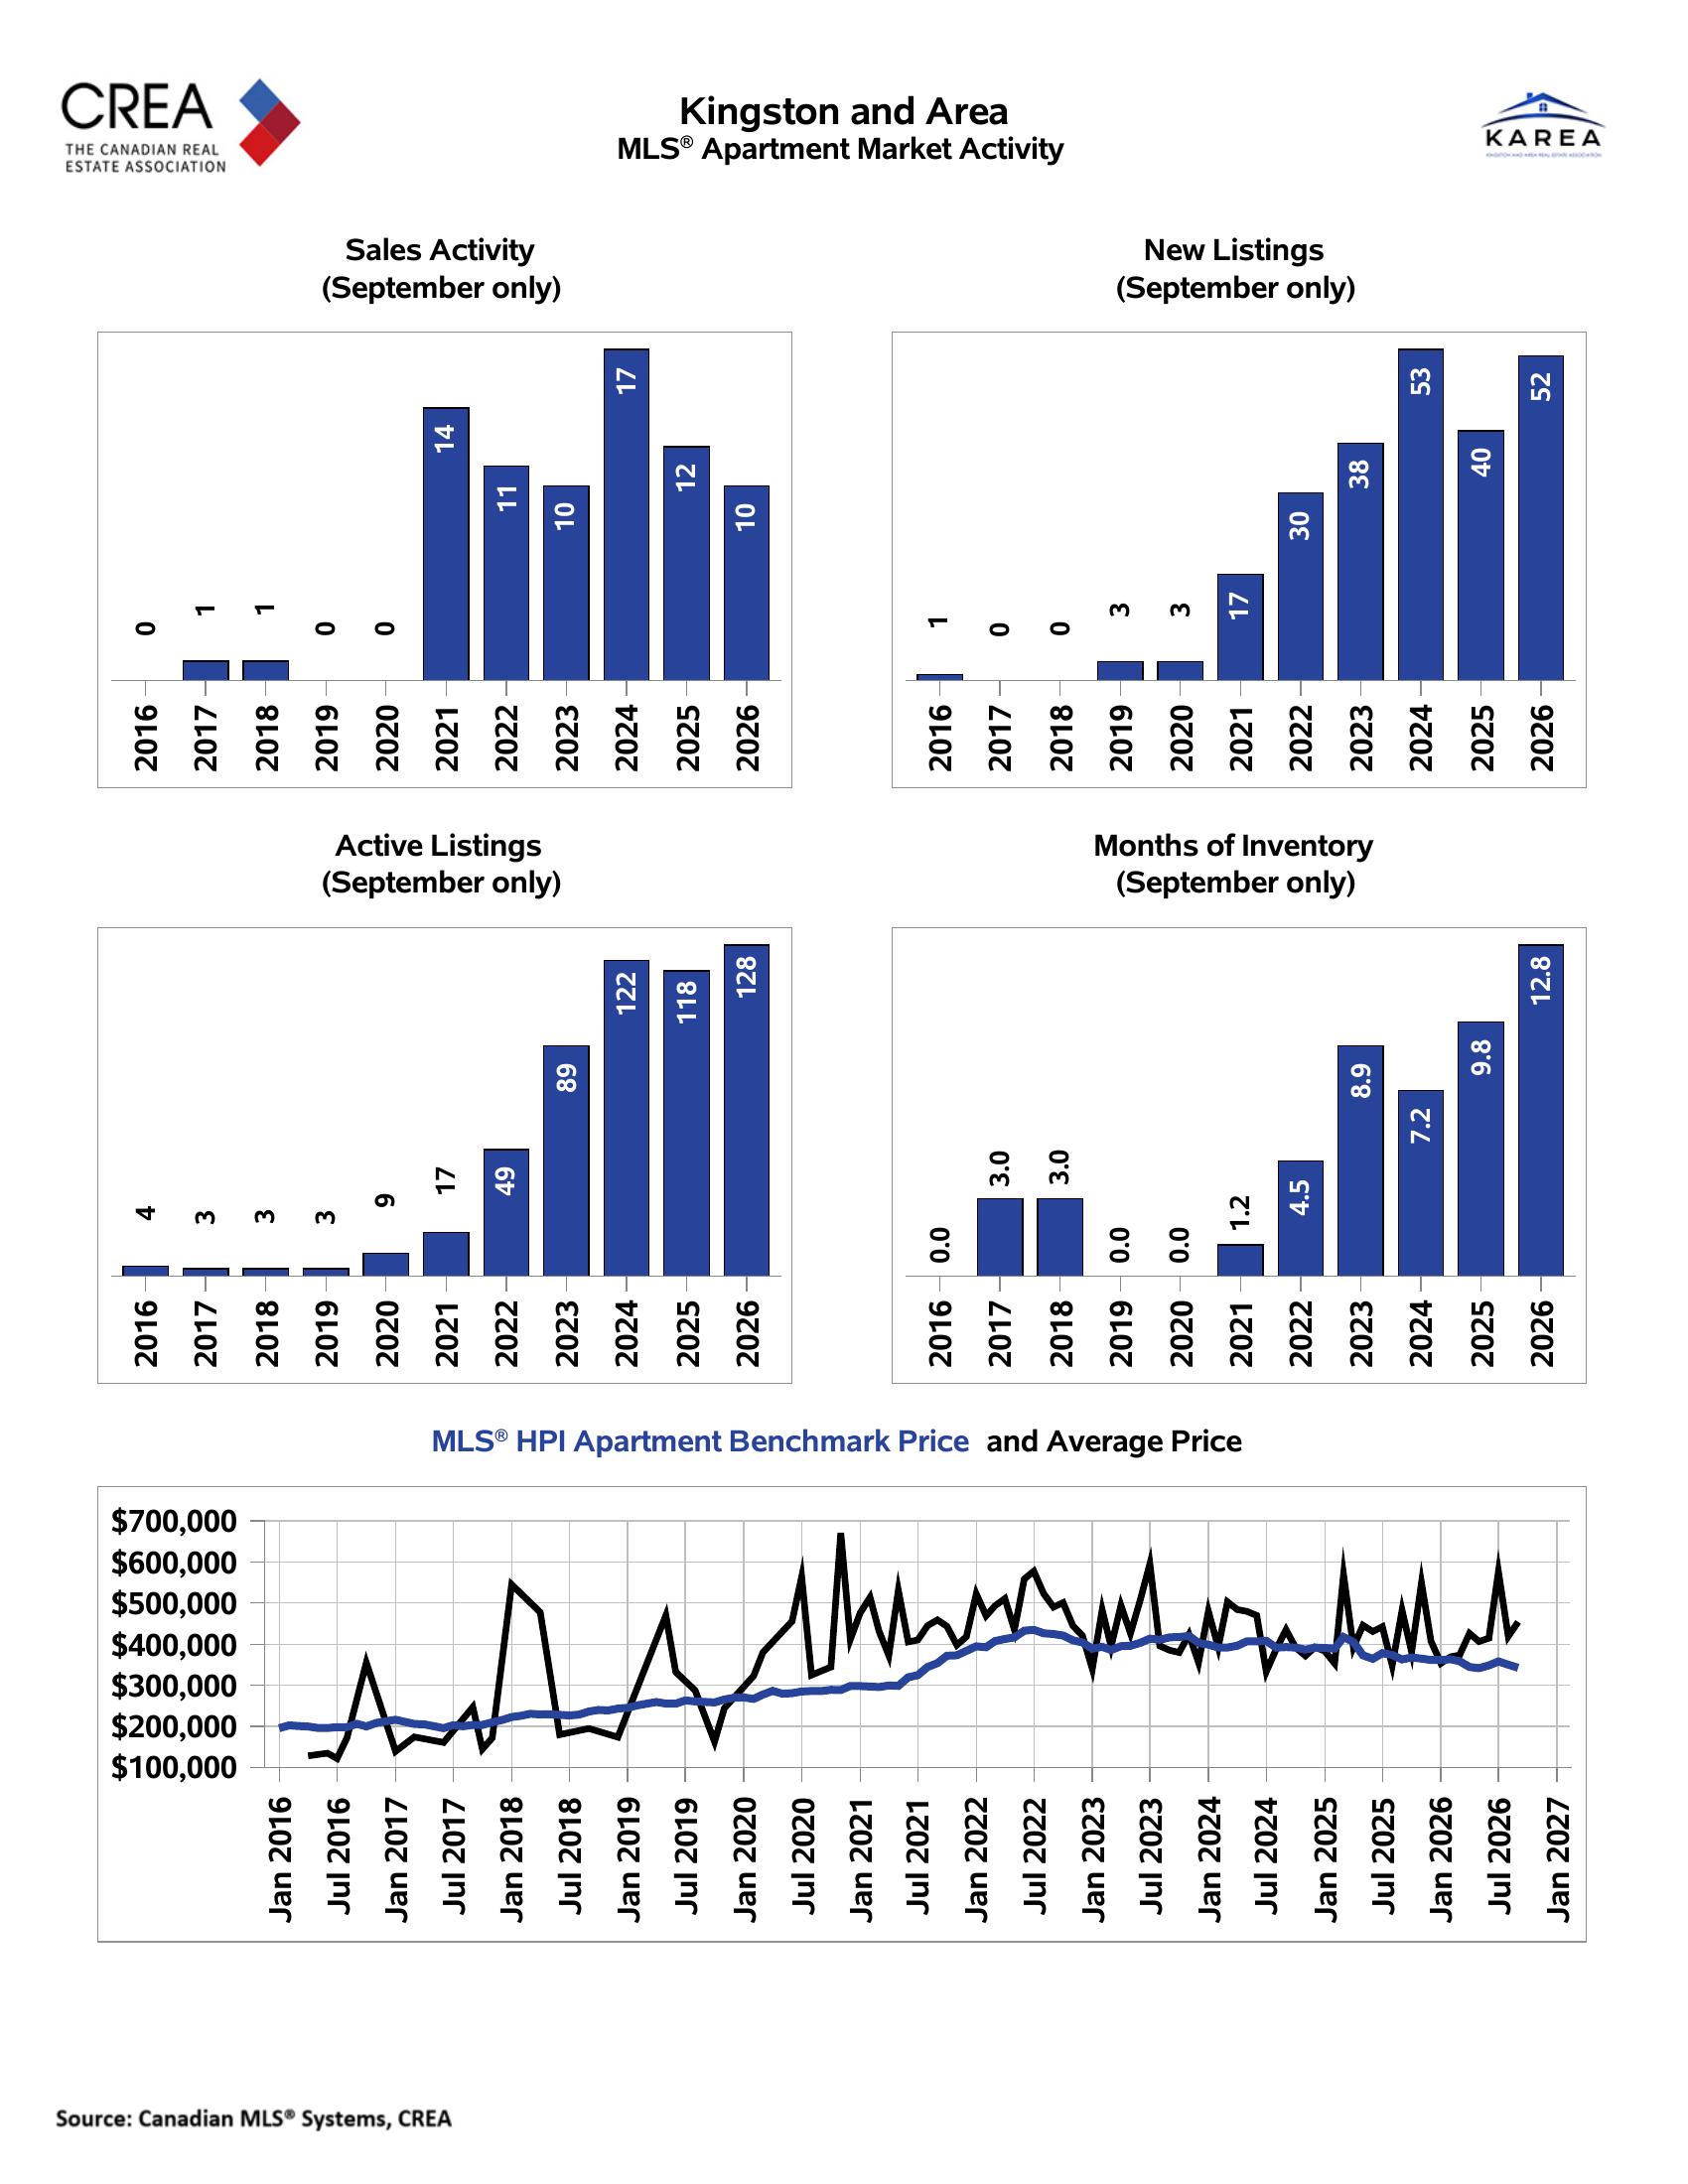
Buyers looking at condos may have more time to compare buildings, condo fees, parking, reserve funds, unit condition, and location than they would in a tighter market.
Kingston and the surrounding communities did not move together.
One of the most important lessons from September 2026 is that we cannot treat Kingston and the area as one uniform market.
South Frontenac recorded 16 residential sales, down 38.5% from a year earlier. New listings increased 22.6%, and months of inventory rose from 4.7 to 8.5.
Yet the average selling price increased 10.1% to $743,378.
That does not mean rural property values suddenly increased by 10%. With only 16 sales, the type and price range of the properties sold can substantially affect the monthly average.
Loyalist moved differently. Residential sales rose 66.7% to 25, up from last September. Months of inventory fell from 8.4 to 5.2, even though the average selling price declined 14.1% to $614,264.
Greater Napanee recorded 24 sales, up 26.3%. Months of inventory declined from 7.3 to 6.2, while the average selling price fell 14.9% to $500,958.
These differences reinforce why buyers and sellers need to look at the municipality, neighbourhood, property type, price range, and recent comparable sales rather than relying on one Kingston and area average.
What September 2026 means for buyers
For buyers, September 2026 offered more choice than a year earlier.
More active listings let buyers compare properties rather than feel they must pursue every suitable home immediately. Depending on the property and competition, buyers may also find it easier to secure financing and inspection conditions than in much tighter markets.
That does not mean buyers should assume every seller will negotiate heavily.
A properly priced property in good condition can still sell quickly, particularly if it has features that are difficult to replace.
The difference is that buyers now have more alternatives if a particular home doesn’t offer good value.
What September 2026 means for sellers
For sellers, more competing inventory makes pricing especially important.
Buyers can compare properties online before deciding which homes to view. Buyers may pass on a listing that appears noticeably overpriced compared with competing properties before they ever book a showing.
Condition, presentation, marketing, photography, and access for showings all matter, but the asking price still has to make sense within the current market.
The increase in days on market also means sellers should expect sales to take longer than in recent years’ fastest markets.
September 2026 presented a complex market situation.
September 2026 showed a Kingston and area market with more inventory, slower overall sales, and longer selling times.
Single-family sales increased, townhouse activity dropped sharply, apartment inventory remained high, and individual communities produced different results.
The benchmark numbers also show that the decline in the monthly average price does not mean every home’s value declined by the same amount.
Whether you are buying or selling, the most useful market information applies to the specific property type and location.
I will also publish a separate three-quarter 2026 Kingston and Area market report, covering January through September rather than focusing on one month.
For a month-to-month comparison, you can also read my August 2026 Kingston and Area market report
Source: Kingston and Area Real Estate Association / Canadian Real Estate Association, September 2026 MLS® Residential Market Activity and Home Price Index Report.